2.4 Exercises
Conceptual
Q1. For each of parts (a) through (d), indicate whether we would generally expect the performance of a flexible statistical learning method to be better or worse than an inflexible method. Justify your answer.
(a) The sample size n is extremely large, and the number of predic- tors p is small.
Sol: Better
(b) The number of predictors p is extremely large, and the number of observations n is small.
Sol: Worse
(c) The relationship between the predictors and response is highly non-linear.
Sol: Better
(d) The variance of the error terms, i.e. σ2 = Var(ε), is extremely high.
Sol: Worse, as flixible model will try to fit the error term too.
Q2. Explain whether each scenario is a classification or regression prob- lem, and indicate whether we are most interested in inference or pre- diction. Finally, provide n and p.
(a) We collect a set of data on the top 500 firms in the US. For each firm we record profit, number of employees, industry and the CEO salary. We are interested in understanding which factors affect CEO salary.
Sol: Regression and Inference; n=500, p=3
(b) We are considering launching a new product and wish to know whether it will be a success or a failure. We collect data on 20 similar products that were previously launched. For each product we have recorded whether it was a success or failure, price charged for the product, marketing budget, competition price, and ten other variables.
Sol: Classification and Prediction; n=20, p=13
(c) We are interested in predicting the % change in the USD/Euro exchange rate in relation to the weekly changes in the world stock markets. Hence we collect weekly data for all of 2012. For each week we record the % change in the USD/Euro, the % change in the US market, the % change in the British market, and the % change in the German market.
Sol: Regression and Prediction; n=Weeks in a year, p=3
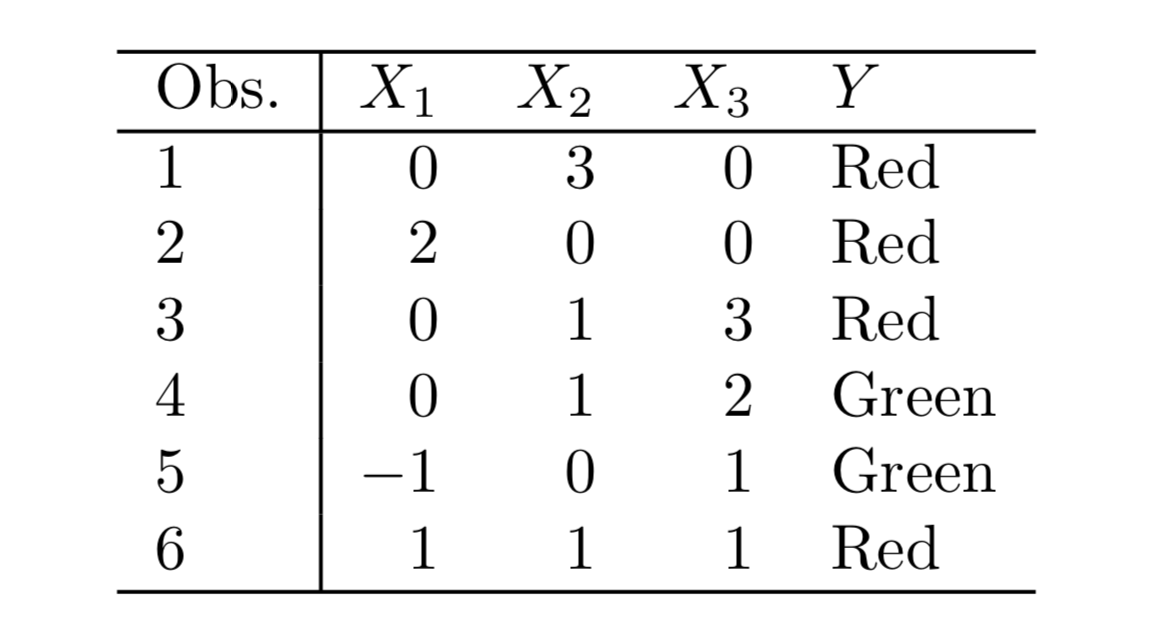
Q7. The table below provides a training data set containing six observa- tions, three predictors, and one qualitative response variable.

Suppose we wish to use this data set to make a prediction for Y when X1 = X2 = X3 = 0 using K-nearest neighbors.
(a) Compute the Euclidean distance between each observation and thetestpoint,X1 =X2 =X3 =0.
Sol: The Euclidean distance between the test point and the observations is as follows:
{Obs 1: 3, Obs 2: 2, Obs 3: $\sqrt{10}$, Obs 4: $\sqrt{5}$, Obs 5: $\sqrt{2}$, Obs 6: $\sqrt{3}$}
(b) What is our prediction with K = 1? Why?
Sol: The prediction with K=1 is the class of the nearest point which is Green.
(c) What is our prediction with K = 3? Why?
Sol: The three nearest points are : Observations 5,6 and 2 with their classes as Green, Red and Red and hence the prediction will be Red.
(d) If the Bayes decision boundary in this problem is highly non- linear, then would we expect the best value for K to be large or small? Why?
Sol: For highly non-linear Bayes decision boundary, the value of K will be small.