There are several metrics that can be used to measure the performance of a classification algorithm. The choice for the same depends on the problem statement and serves an important role in model selection.
### Confusion Matrix :Confusion matrix is one of the easiest and the most intutive way to find the correctness and accuracy of the model. It serves as the building block for all the other performance measures. A sample confusion matrix is shown below:
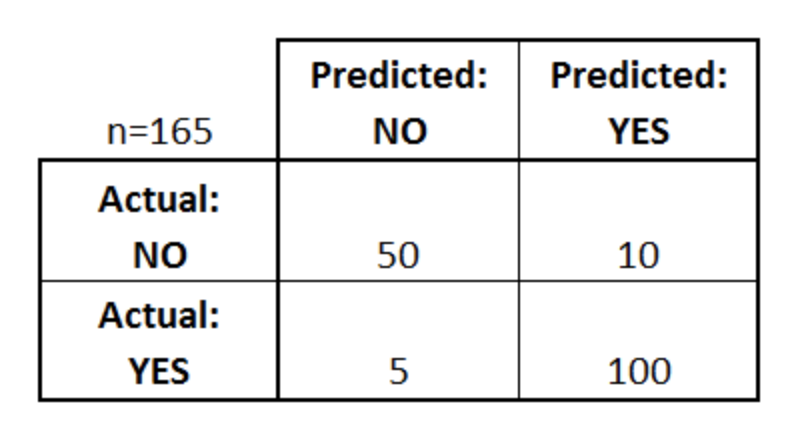
True Positive (TP) is the cell which has both the actual and predicted classes as True. False Positive (FP) is the cell for which the actual class label is False but the predicted class label is True. True Negative (TN) is the cell for which both the actual and predicted class labels are False. False Negative (FN) is the cell for which the actual class label is True but the predicted class label is False. In the above confusion matrix, TP = 100, FP = 10, TN = 50, FN = 5.
All these quantities have different and important effects when it comes to the problem statement. For example, in the case of a model which detects the cancerous cell, we need to minimize the False Negative as miss classifying a cancerous tumor as non-cancerous will have a significant impact. In the case of the model which identifies spam emails, we need to minimize False Positive rate, as they will lead to the classification of important emails as spams.
### Accuracy :Accuracy of a classification model is given as:
$$Accuracy = \frac{TP+TN}{Number \ of \ Observations} = \frac{TP+TN}{TP+FP+TN+FN}$$
Accuracy is a good measure for the fit when the target class labels are balanced. We should refrain ourselves from using accuracy as the measure when the target class labels has a majority of one class.
### Precision and Recall (Sensitivity) :Precision is the measure which tells us that out of all the observations that are predicted as true, what fraction is actually true. It is given as:
$$Precision = \frac{TP}{TP+FP}$$
Recall is a measure that tells us that out of all the actual true class labels, how many are correctly classified by the model. It is given as:
$$Recall = \frac{TP}{TP+FN}$$
If we want to minimize FP, we should be maximizing precision and if we want to minimize FN, we should be maximizing recall. Hence, in the case of cancerous cell detection, we have to minimize FN and hence we should maximize recall. For the model that identifies spam emails, our goal is to minimize FP and hence we should maximize precision.
### Specificity and F1 Score :Specificity measures the classification accuracy for the true negative observations in the data set. It is given as:
$$Specificity = \frac{TN}{TN+FP}$$
F1 Score is the harmonic mean of precision and recall.
$$F1 \ Score = \frac{2 \times Precision \times Recall}{Precision + Recall}$$
### AUC-ROC Curve :AUC(Area under the Curve)-ROC(Receiver Operating Characteristics) Curve is one of the most important measure of the classification performance. ROC curve is plotted as true positive rate (TPR) against false positive rate (FPR). TPR is the classification accuracy rate for the true positive observations, which can be given as $\frac{TP}{TP+FN} = Recall$. FPR is the false positive rate and tells us about the fraction of true negative observations which are falsely classified as positive and is given as $\frac{FP}{FP+TN} = 1 - Specificity$. An ideal or favorable ROC curve should be hugging the top left corner and should have an area closed to 1 under it. The ROC curve with an area of 0.5 tells that the classifier has no classification power as such.
### Reference :https://www.dataschool.io/simple-guide-to-confusion-matrix-terminology/
https://towardsdatascience.com/understanding-auc-roc-curve-68b2303cc9c5