The basic idea to conduct the hypothesis test for difference between two means is to find the distribution for the difference of two means and test whether it is equal to 0 or not. Here is an example.
Example: Suppose that a production manager for a manufacturer of industrial machinery is concerned that ball bearings produced in environments with low ambient temperatures may have smaller diameters than those produced under higher temperatures. To investigate this concern, she samples 120 ball bearings that were manufactured early in the morning, before the shop was fully heated, and finds their mean diameter to be 5.068 mm and their standard deviation to be 0.011 mm. She independently samples 65 ball bearings manufactured during the afternoon and finds their mean diameter to be 5.072 mm and their standard deviation to be 0.007 mm. Can she conclude that ball bearings manufactured in the morning have smaller diameters, on average, than ball bearings manufactured in the afternoon?
Sol: Let $X$ and $Y$ denote the samples from the morning and afternoon respectively. Then, $\mu_X = 5.068$, $n_X = 120$, $s_X = 0.11$, $\mu_Y = 5.072$, $n_Y = 65$, $s_X = 0.007$. We can formulate the null and alternate hypothesis as:
$$H_0: \mu_X - \mu_Y \geq 0$$
$$H_A: \mu_X - \mu_Y < 0$$
Since both the sample size is large enough, $\overline{X}$ and $\overline{Y}$ are normally distributed and hence the distribution of $\overline{X} - \overline{Y}$ can be given as:
$$\overline{X} - \overline{Y} \sim N(\mu_X - \mu_Y, \sigma _{\overline{X}}^2 + \sigma _{\overline{Y}}^2) = N\bigg(\mu_X - \mu_Y, \frac{\sigma _{{X}}^2}{n_X} + \frac{\sigma _{{Y}}^2}{n_Y} \bigg)$$
As the sample size is large, we can estimate the population standard deviation from sample standard deviation, i.e. $\sigma_X = s_X = 0.011$ and $\sigma_Y = s_Y = 0.007$. Hence, the standard deviation of the null disstribution is $\sqrt{0.011^2 /120 + 0.007^2 /65} = 0.001327$. The null distribution is given as:
$$\overline{X} - \overline{Y} = N(0, 0.001327^2)$$
The observed value is $\overline{X} - \overline{Y} = -0.004$, which gives the z-score as:
$$z-score = \frac{-0.004 - 0}{0.001327} = -3.01$$
and hence the p-value is 0.0013, which makes the null hypothesis to be rejected. The alternate hypothesis is true, whcih means that the manager’s suspicion is correct.
We can also conduct a test for the statement that whether the two population means differ by some value or not. The structure of the test will be (rest of the things remain the same):
$$H_0: \mu_X - \mu_Y \leq \Delta_0$$
$$H_A: \mu_X - \mu_Y > \Delta_0$$
$$test \ statistic (z) = \frac{(\overline{X} - \overline{Y}) - \Delta_0}{\sqrt{\sigma_X^2/n_X + \sigma_Y^2/n_Y}}$$
It should be noted that it is more appropriate to use t-statistic than the z-statistic whenever sample standard deviation is used to estimate the population standard deviation. For a large sample size, z-distribution approximates the t-distribution and hence can be used instead.
### Tests for the Difference Between Two Means (Small-Sample) :The hypothesis test for the difference between two means for a small sample size can be conducted in a similar manner. As the sample size is small, the central limit theorem does not apply and if both the populations are approximately normal, t-distribution can be used instead. Here is an example:
Example: Assume that in an experiment, six identically prepared DNA specimens are prepared without the enzyme, and the numbers of a specific molecules counted are 33, 30, 26, 22, 37, and 34. Assume that in four identically prepared specimens with the enzyme present, the counts were 22, 29, 25, and 23. Can we conclude that the counts are lower when the enzyme is present?
Sol: As the sample size is small, we can not apply the central limit theorem. Let the samples without the enzyme is denoted by $X$ and the one with the enzyme is denoted by $Y$. Then, $\overline{X} = 30.333$, $n_X = 6$, $s_X = 5.538$, $\overline{Y} = 24.750$, $n_Y = 4$, $s_Y = 3.096$. The null and alternate hypothesis can be formulated as:
$$H_0: \mu_X - \mu_Y \leq 0$$
$$H_A: \mu_X - \mu_Y > 0$$
As the sample size is small, the following quantity approximately follows the Student’s t distribution
$$\frac{(\overline{X} - \overline{Y}) - (\mu_X - \mu_Y)}{\sqrt{s_X^2/n_X + s_Y^2/n_Y}}$$
with degree of freedom $v$ given as
$$v = \frac{(s_X^2/n_X + s_Y^2/n_Y)^2}{\bigg(\frac{s_X^2/n_X}{n_X-1} + \frac{s_Y^2/n_Y}{n_Y-1}\bigg)}$$
Under the assumption that the null hypothesis is true, the test statistic is given as:
$$t = \frac{(\overline{X} - \overline{Y}) - 0}{\sqrt{s_X^2/n_X + s_Y^2/n_Y}} = \frac{5.583 - 0}{2.740} = 2.038$$
From the t table, we can find that 0.025 < p-value < 0.05 , and hence the null hypothesis can be rejected stating that the mean count without the enzyme is lower.
We can also conduct a test for the statement that whether the two population means differ by some value or not. The structure of the test will be (rest of the things remain the same):
$$H_0: \mu_X - \mu_Y \leq \Delta_0$$
$$H_A: \mu_X - \mu_Y > \Delta_0$$
$$test \ statistic (t) = \frac{(\overline{X} - \overline{Y}) - \Delta_0}{\sqrt{s_X^2/n_X + s_Y^2/n_Y}}$$
When the populations have equal variances, pooled variance can be used, which is given as:
$$s_p^2 = \frac{(n_X-1)s_X^2 + (n_Y-1)s_Y^2}{n_X + n_Y - 2}$$
The test statistic for the testing of equality of mean can be given as:
$$t = \frac{\overline{X} - \overline{Y}}{s_p \sqrt{1/n_X + 1/n_Y}}$$
Under the assumption that the null hypothesis is true, the test statistic follows Student’s t distribution with degree of freedom $n_X + n_Y - 2$.
Example: Two methods have been developed to determine the nickel content of steel. In a sample of five replications of the first method on a certain kind of steel, the average measurement (in percent) was $\overline{X} = 3.16$ and the standard deviation was $s_X = 0.042$. The average of seven replications of the second method was $\overline{Y} = 3.24$ and the standard deviation was $s_Y = 0.048$. Assume that it is known that the population variances are nearly equal. Can we conclude that there is a difference in the mean measurements between the two methods?
Sol: First of all, as we have to find that whether the means are equal or not, the null and alternate hypothesis will be:
$$H_0: \mu_X = \mu_Y$$
$$H_A: \mu_X \neq \mu_Y$$
The pooled standard deviation can be calculated as:
$$s_p = \sqrt{\frac{(n_X-1)s_X^2 + (n_Y-1)s_Y^2}{n_X + n_Y - 2}} = 0.0457$$
Hence, the t-statistic is:
$$t = \frac{3.16-3.24}{0.0457 \sqrt{1 /5 + 1 /7}} = -2.990$$
As this is a two-tailed test, we need to sum the area between the left and the right tails, which gives the p-value as: 0.01 < p-value < 0.02. Hence, we can reject the null hypothesis, stating that the two means are different.
We should refrain ourselves from making the assumption that the population variances are equal based on the equality of sample variances. The test for the difference of two means by a specific quantity can be conducted in a similar way as described above.
### Tests with Paired Data :The test with paired data can be conducted in a similar way as the calculation of the confidence interval. We can treat the collection of differnces as the single random sample from the population of differences. Rest of the proceduer remains the same.
Example: The emission of the automobiles for two conditions is shown below.
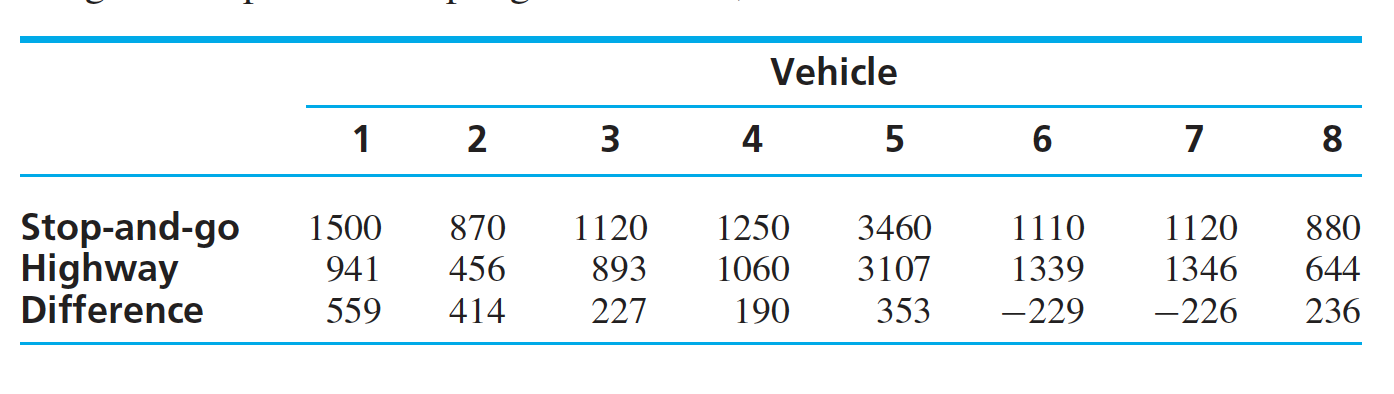
Can we conclude that the mean level of emissions is less for highway driving than for stop-and-go driving?
Sol: The mean and standard deviation for the differences are : $\overline{D} = 190.5$, $s_D = 284.1$. The null and alternate hypothesis can be designed as:
$$H_0: \mu_D \leq 0$$
$$H_A: \mu_D > 0$$
The test statistic is given as (the test is for small samples):
$$t = \frac{\overline{D} - 0}{s_D/\sqrt{n}} = \frac{190.5 - 0}{284.1/\sqrt{8}} = 1.897$$
which gives the p-value barely less than 0.05.
### Reference :https://www.mheducation.com/highered/product/statistics-engineers-scientists-navidi/M0073401331.html